Ratnaparkhi PPs
This dataset is automatically extracted from the Penn Treebank, and in each tuple, both V and N1 appear in the same sentence with N1 as the object of V, and the PP following.
Since SEM-D is formulated in terms of MRS predication names, we have to guess predications from lemmas when processing the Ratnaparkhi dataset. This inevitably adds noise.
Note that tuples with the preposition "of" have been excluded from this analysis, since in this dataset they are uniformly marked as nominal attachments.
|
WeScience PPs
This dataset is automatically extracted from the WeScience Treebank.
V and N1 are not guaranteed to have the same relationship here that they do in the Ratnaparkhi dataset; they could be competing candidate analyses for the same token; they could appear in a syntactic configuration other than N1 being the object of V.
|
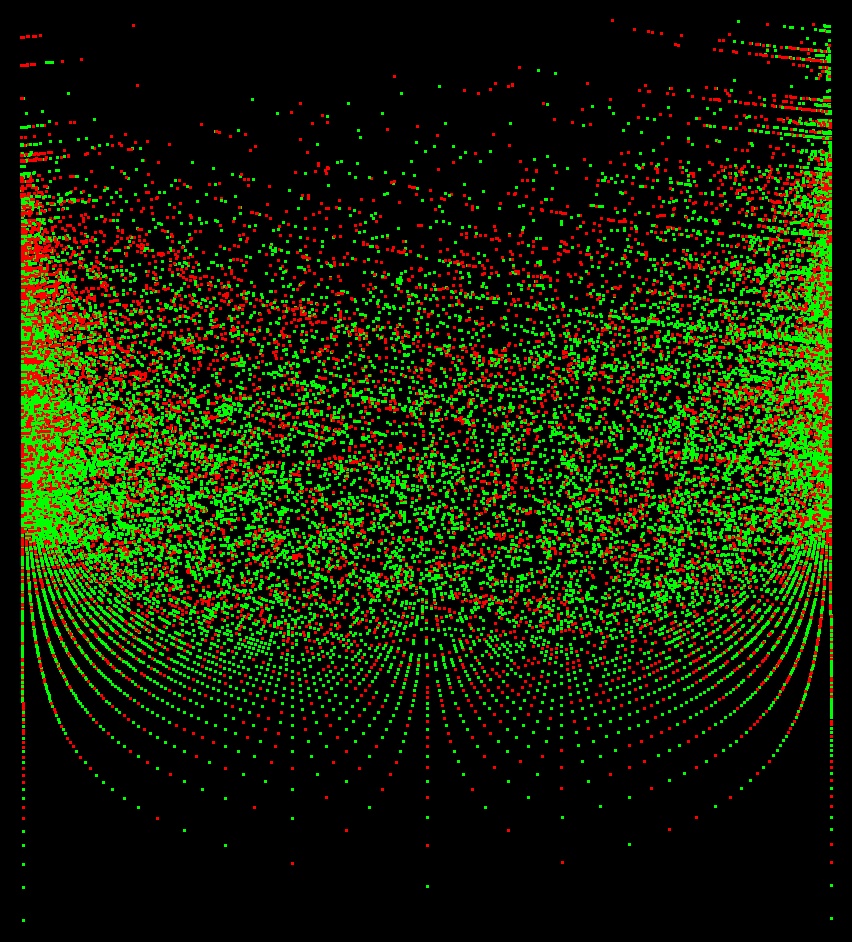 SEM-D's opinion (#(v,p) / (#(v,p) + #(n,p))) on the X axis (nominal attachment left, verbal attachment right); #(v,p) + #(n,p) on the Y axis.
Predictor accuracy: 67.3% of decidable items.
SEM-D's opinion (#(v,p) / (#(v,p) + #(n,p))) on the X axis (nominal attachment left, verbal attachment right); #(v,p) + #(n,p) on the Y axis.
Predictor accuracy: 67.3% of decidable items.
|
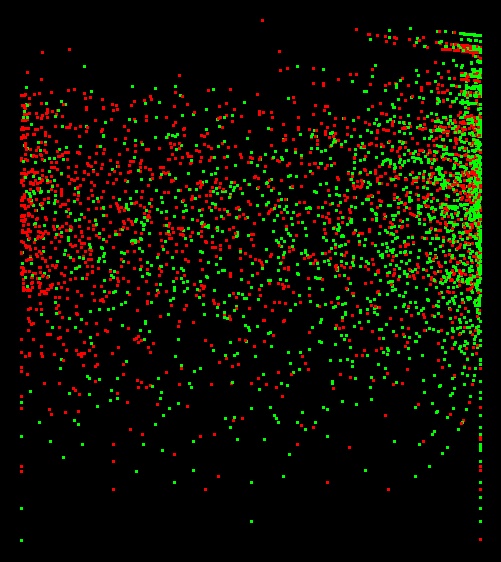 SEM-D's opinion (#(v,p) / (#(v,p) + #(n,p))) on the X axis (nominal attachment left, verbal attachment right); #(v,p) + #(n,p) on the Y axis.
Predictor accuracy: 73.6% of decidable items.
SEM-D's opinion (#(v,p) / (#(v,p) + #(n,p))) on the X axis (nominal attachment left, verbal attachment right); #(v,p) + #(n,p) on the Y axis.
Predictor accuracy: 73.6% of decidable items.
|
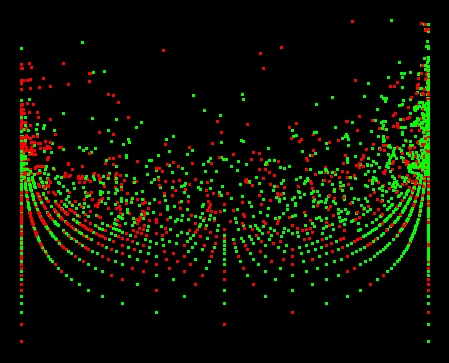 SEM-D's opinion (#(v,p,o) / (#(v,p,o) + #(n,p,o))) on the X axis (nominal attachment left, verbal attachment right); #(v,p,o) + #(n,p,o) on the Y axis.
Predictor accuracy: 64.0% of decidable items.
SEM-D's opinion (#(v,p,o) / (#(v,p,o) + #(n,p,o))) on the X axis (nominal attachment left, verbal attachment right); #(v,p,o) + #(n,p,o) on the Y axis.
Predictor accuracy: 64.0% of decidable items.
|
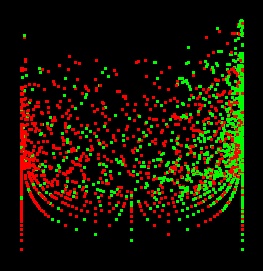 SEM-D's opinion (#(v,p,o) / (#(v,p,o) + #(n,p,o))) on the X axis (nominal attachment left, verbal attachment right); #(v,p,o) + #(n,p,o) on the Y axis.
Predictor accuracy: 76.9% of decidable items.
SEM-D's opinion (#(v,p,o) / (#(v,p,o) + #(n,p,o))) on the X axis (nominal attachment left, verbal attachment right); #(v,p,o) + #(n,p,o) on the Y axis.
Predictor accuracy: 76.9% of decidable items.
|
What we are looking for is a clear separation of the red points from the green points.
That would indicate that SEM-D's opinion contains the information needed to distinguish red points from green points automatically.
While the images above all show (to varying degrees) a trend of red on the left and green on the right,
they also all show significant mixing across the entire graph.
What that means is that these metrics are not by themselves sufficient for determining PP attachment.
The WeScience data is slightly better separated than the Ratnaparkhi data, although really enough to base a good prediction on.
This is perhaps related to the fact that we don't have to guess predication names for WeScience, and is also likely related to the broader problem definition (although I would have guessed that the less uniform tuples in this dataset would have been harder to disambiguate rather than easier).
By the way, the fun pattern the dots take towards the bottom of the graphs is just an artifact of the equations used for plotting. Also note that the vertical axes are all log-scale.